My latest article is now online in City Journal, and is about the need for New York to start thinking like a growth city again. It's interesting to contrast NYC with the case of Atlanta I recently wrote about. Atlanta has seen decelerating growth indicating it may be nearing maturity. New York long ago transitioned to maturity. But then the city started to experience growth once again, entering, if not its historic boom era growth, at least a much higher demand phase. But it has been unable to respond to the problem. In part I argue that comes … [Read more...]
A New Mayor for Chicago and Congestion Pricing for New York

My colleague Nicole Gelinas and I recorded a podcast for City Journal recently about recent developments in New York and Chicago. She talked about New York's approval of congestion pricing and I covered the Chicago mayoral election. If the audio player doesn't display for you, click over to listen on Soundcloud. https://soundcloud.com/aaronrenn/updates-on-chicago-new-mayor-and-new-york-congestion-pricing Subscribe to podcast via iTunes | Soundcloud. Cover image credit: Daniel Schwen, CC BY-SA 4.0 … [Read more...]
The Tech Campus Moves Downtown

My latest City Journal article from the Winter issue is now online. It's called "The Tech Campus Moves Downtown" and is about states and universities making geographic moves to better position themselves for the 21st century. It talks a lot about the University of Illinois and its Discovery Partners Institute plan, as well as Cornell Tech. Some excerpts: Much of today’s technology economy is located where a critical mass of talent and capital converge: on the campuses of elite research universities, in settings with strong entrepreneurial … [Read more...]
New York City’s Infrastructure Future
My latest podcast features Tom Wright, president of the Regional Plan Association in New York. We talk about his very unique organization, the threat to the region posed by the Amtrak and commuter rail tunnels under the Hudson River, resolving the New York region's governance dysfunction, the highest priority infrastructure needs in the region, and a bit about megaregions. It was a great conversation. If the audio player doesn't display for you, click over to listen on … [Read more...]
Superstar Effect Wins Again as Amazon Chooses New York, Washington for HQ2/3

Amazon, obviously embarrassed at the way their HQ2 process has been received, leaked the results of the competition the night before Election Day, ensuring coverage will be largely muted. Amazon has reportedly decided to split HQ2 between two locations, New York City (Long Island City, Queens) and Washington (Crystal City, VA). I will have more analysis over the next several days, but this shows that the superstar effect is alive and well. Amazon chose note one but two elite coastal cities for its new headquarters. There's no other way … [Read more...]
The Brooklynization of Brooklyn

The New Brooklyn: What It Takes to Bring a City Back by Kay Hymowitz My City Journal colleague Kay Hymowitz has written a number of great articles on Brooklyn, the borough that is her home. This inspired her to write a great book on the topic of the transformation of Brooklyn called The New Brooklyn. It starts with a two-chapter history of the borough from its earliest settlement to the present day, followed by a series of chapters looking at Brooklyn today. This includes the transformation of Park Slope (where she and her husband moved … [Read more...]
William H. Whyte’s Original Plan to Save Bryant Park
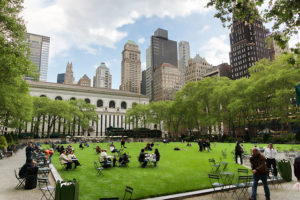
William H. "Holly" Whyte, the former Fortune magazine editor best known in urban circles for his classic book The Social Life of Small Urban Spaces, famously did a report on Bryant Park in the 1970s that was ultimately used as a basis for transforming what was then known as "Needle Park." Andrew Manshel used to work for Bryant Park Corporation, the entity that actually did transform and still runs the park. (If you get a chance to see Bryant Park Corp. CEO Dan Biederman give a talk, be sure to take it). He now runs an excellent web site on … [Read more...]
The Cultural Power of New York City
I've never been a huge theater guy in general, much less Broadway shows. So I never paid that much attention to it. But the smash success of Hamilton is something hard to ignore. And it really provides a window into the overwhelming cultural power of New York. Hamilton is a play that is running at a theater that seats 1,300 people. You'd think that by its very nature as one play, in one city, in a not that big venue, it would be limited in the effects it could have. But Hamilton turned out to be a sensation whose effects extended far … [Read more...]
Sun Belt Problems Come to New York City
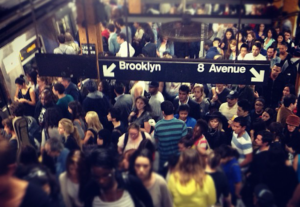
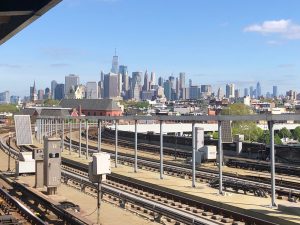
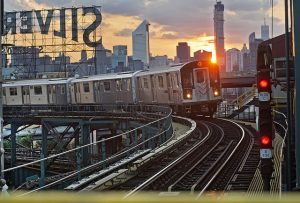
Surging subway ridership in New York has driven a flurry of press recently, including this piece in the New York Times: Subway ridership in New York is in the midst of a resurgence almost unimaginable in the 1970s and ’80s, when the system was defined by graffiti and crime. Ridership has steadily risen to nearly six million daily riders today from about four million in the 1990s. But the subway infrastructure has not kept pace, and that has left the system with a litany of needs, many of them essential to maintaining current service or … [Read more...]
When the Snow Comes Down, New Yorkers Come Out to Play

Much of the eastern US is getting slammed with a blizzard today. But in New York, snow coming down is just yet another reason to get out of the apartment and go play in the park. I went out around 3:00 today and recorded two Periscope videos that you can check out if you want. The first of them is of the cityscape starting at 68th and Columbus, walking south along Columbus and Broadway to Columbus Circle, then into Central Park. The second is a shorter look at people out and about on 72nd St. in Central Park. I had so much fun I was … [Read more...]